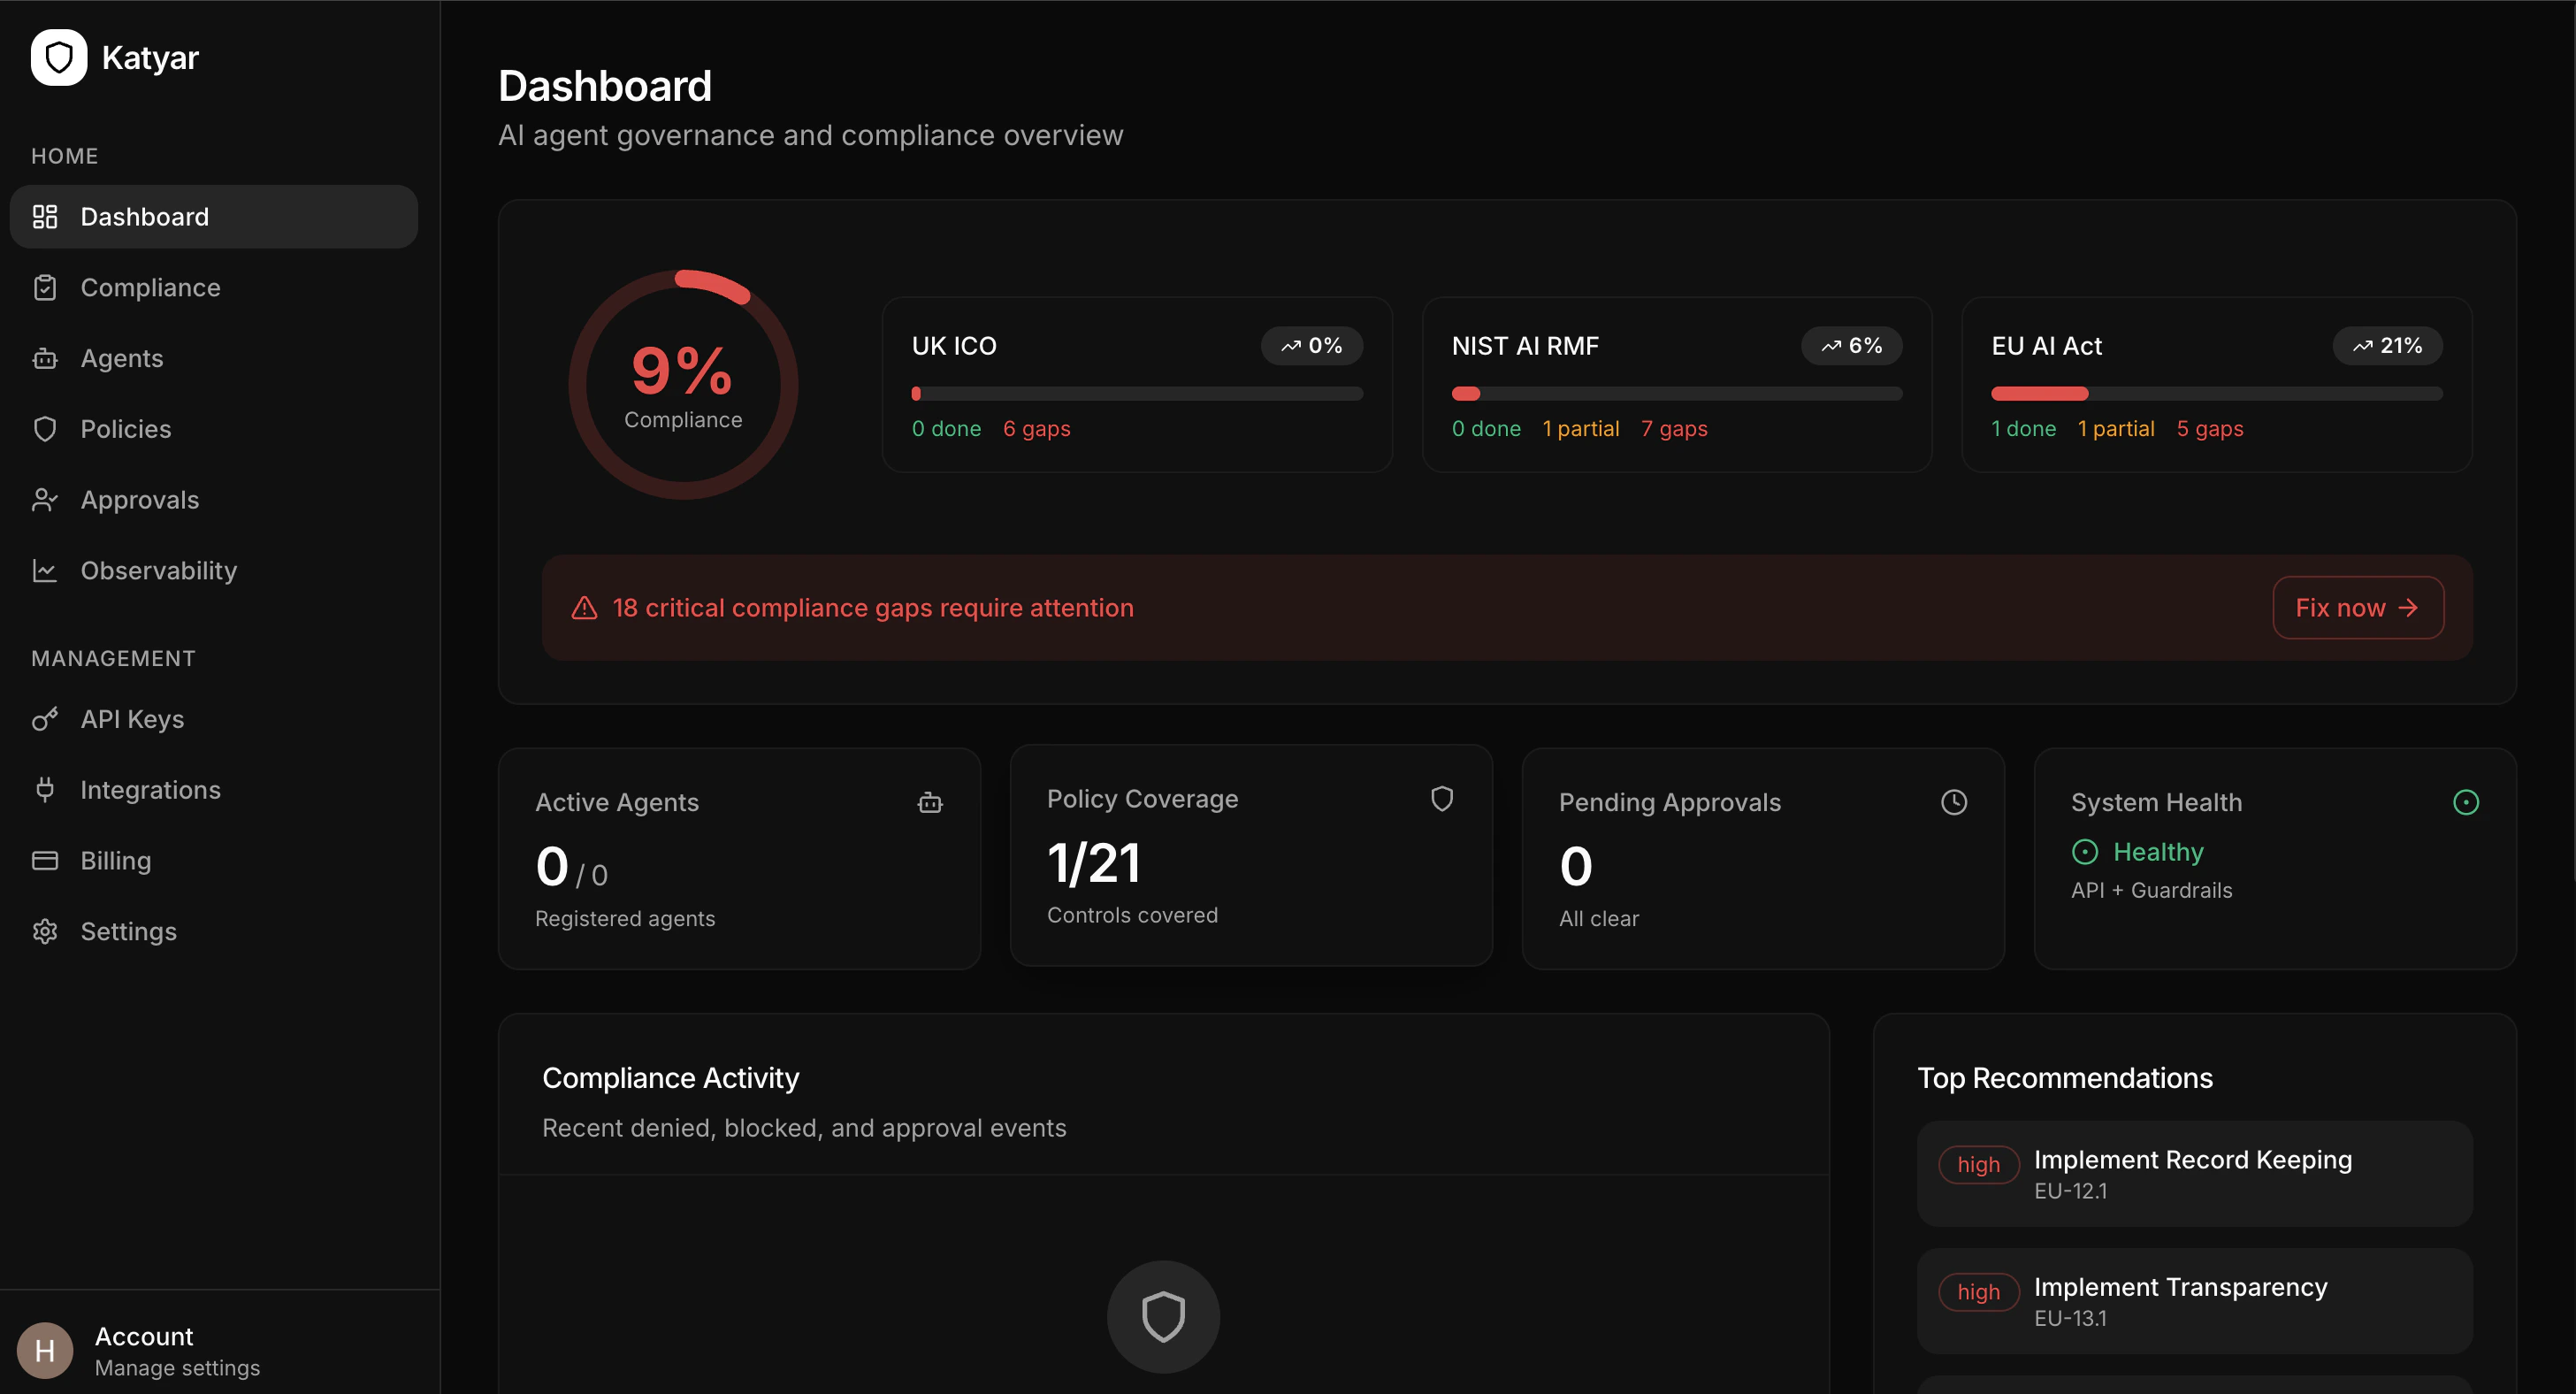
After logging in, this is the first view you’ll see — it gives you an instant overview of AI agent activity, compliance status, pending actions, and system health. You can always return to the Dashboard by clicking the Katyar logo in the top-left corner or selecting Dashboard from the sidebar. The dashboard updates in real time. Any new events, approvals, policy changes, or agent activity will appear automatically.
Dashboard Layout Overview
Compliance Snapshot (Top Section)
The top area shows your current governance and compliance posture at a glance:- Overall Compliance Gauge — Large circular progress ring showing weighted average across all frameworks
- Framework Progress Cards — One card per framework (UK ICO, NIST AI RMF, EU AI Act):
- Progress bar with color coding
- Current percentage
- Breakdown: done / partial / gaps
Critical Gaps Alert
- Prominent banner (red when gaps exist) highlighting urgent issues
- Fix now → button takes you directly to the Compliance page with prioritized recommendations
Key Metrics Row
Four summary cards showing essential numbers:- Active Agents — Number of registered/onboarded agents
- Policy Coverage — Controls covered out of 21 total
- Pending Approvals — Number of waiting human reviews
- System Health — Status of core services (API + Guardrails)
Compliance Activity Feed
- Real-time list of recent events: denied actions, blocked calls, approvals, guardrail triggers
- Shows agent name, policy/tool, status (green/red), and timestamp
Top Recommendations
- Prioritized list of high-impact fixes
- Each item shows priority level and affected control
- Clickable links jump straight to the relevant fix
Sidebar Navigation
The left sidebar is your main way to move around Katyar. It is grouped into logical sections:Quick Access
- Dashboard — Return to this overview
- Compliance — Deep dive into control scores, gaps, evidence, and reports
Core Management
- Agents — View, onboard, risk-rate, and monitor all agents
- Policies — Create, edit, enable/disable governance rules
- Approvals — Review and act on pending human-in-the-loop requests
- Observability — Full event log, traces, guardrail detections, cost tracking
Administration
- API Keys — Generate and revoke agent authentication keys
- Integrations — Connect Slack, LangChain, CrewAI, etc.
- Billing — Track usage, plan limits, and upgrade
- Settings — Workspace config, webhooks, data retention
User Profile (bottom)
- Account settings, logout, and support links
Quick Tips for Using the Dashboard
- Check the compliance gauge first — it shows your current overall posture
- Watch for red alerts — the critical gaps banner flags urgent items
- Use the framework cards to see which regulation needs attention most
- Scan the activity feed — recent denied/blocked events show your governance working
- Act on top recommendations — clicking high-priority items takes you straight to the fix
- Keep the dashboard open — it auto-refreshes and gives instant visibility